A Note on RSV Scenario Modeling Hub Round 1 (February 26, 2024)
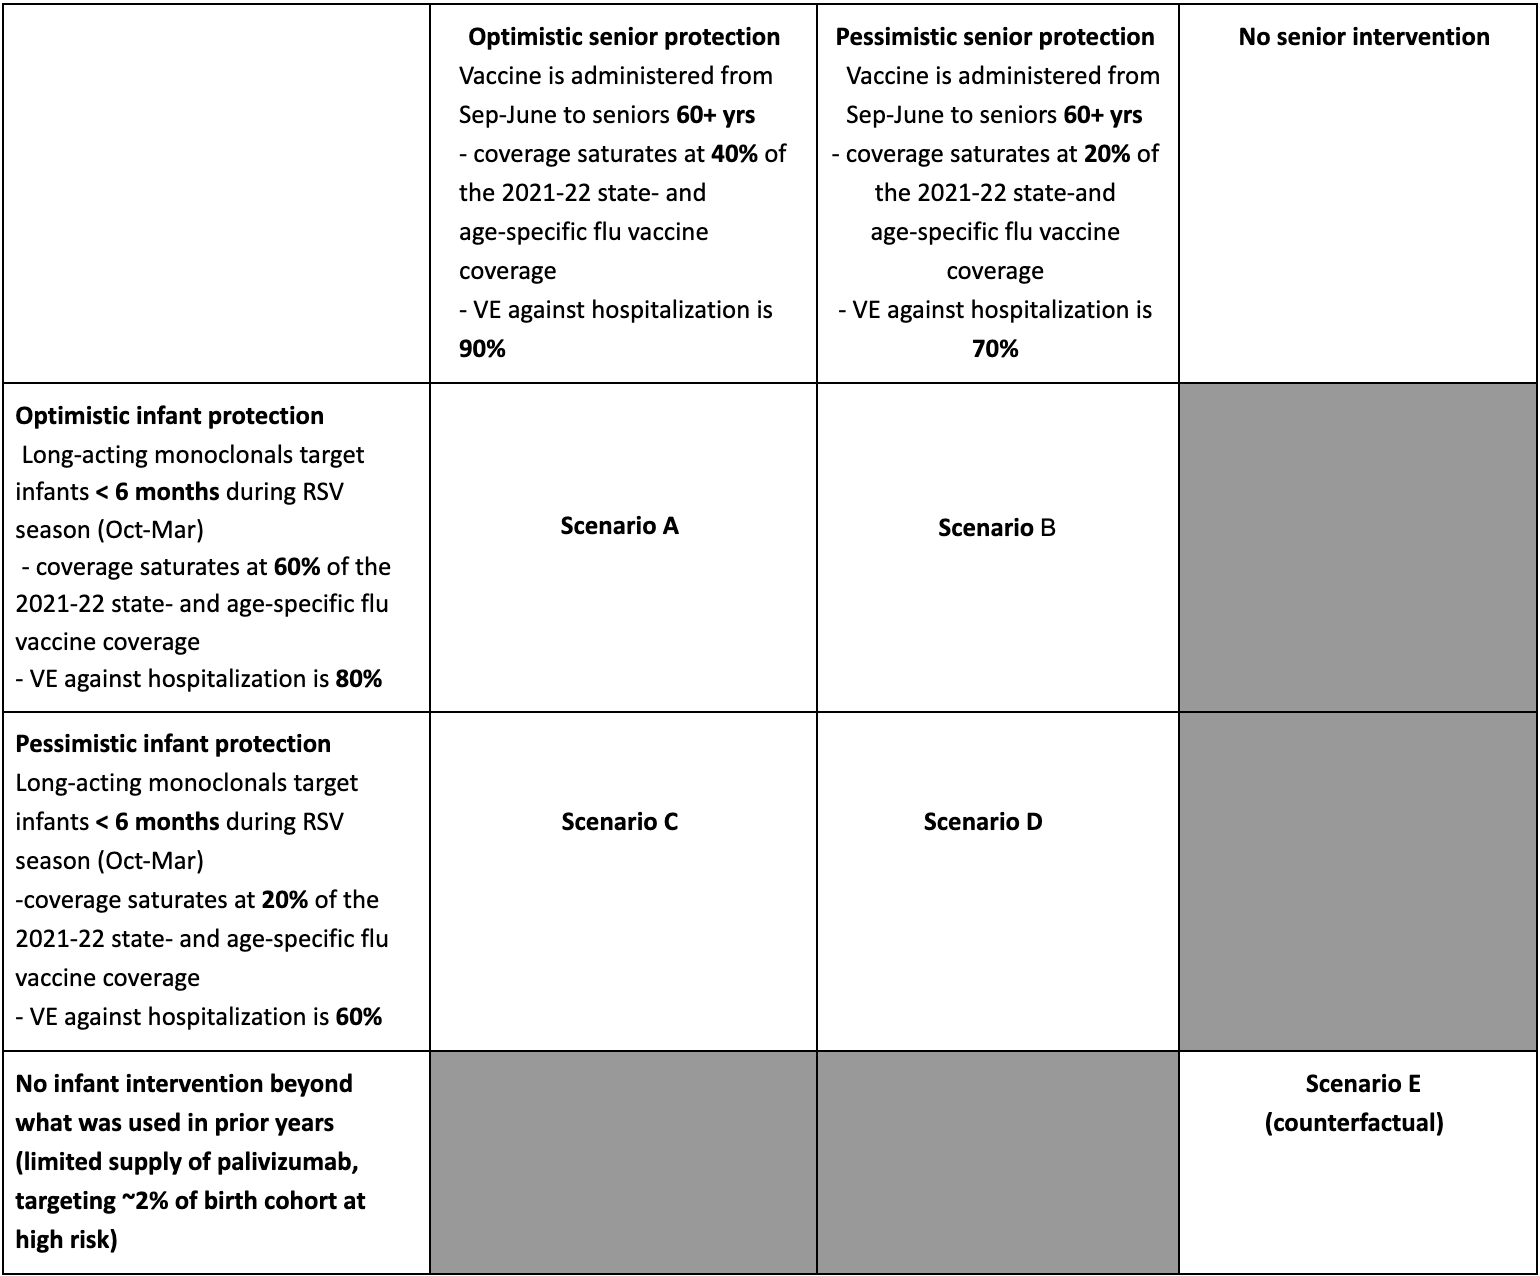
In the first round of RSV scenario projection, the RSV Scenario Modeling Hub generated mid-season hospitalization estimates for the 29-week period Nov 12, 2023 to June 1, 2024. We considered 4 intervention scenarios representing the impact of new interventions to mitigate the burden of RSV, and one counterfactual “status quo” scenario where RSV control mirrors past years. Intervention scenarios assumed optimistic and pessimistic levels of coverage and effectiveness of long-acting monoclonal antibodies (nirsevimab) in infants under 6 mo, combined with optimistic and pessimistic levels of coverage and effectiveness of vaccination in seniors 60+ yrs. Coverage was assumed to saturate at 12% (pessimistic) or 36% (optimistic) among infants, and 14% (pessimistic) or 29% (optimistic) among seniors, indexed on past coverage of influenza vaccines by state and age group. Assumptions regarding efficacy come from randomized control trials for RSV interventions. Ensemble projections are based on contributions from 10 teams, using the trimmed linear opinion pool aggregation approach. All-age and age-specific estimates of RSV hospitalizations are provided nationally and for 12 states contributing to RSV-NET surveillance.
Our main findings include:
- 11% (95% CI 6-16%) of seasonal RSV hospitalizations, or 15,500 nationally (95%CI 9,300-21,600), are projected to be averted in the most optimistic scenario versus no intervention (scenario A, optimistic intervention coverage and high effectiveness in both infants and seniors, compared to status quo scenario).
- With the most pessimistic assumptions, interventions avert 4% (95% CI 2-6%), or 5,800 (95% CI 3,200-8,400) average hospitalizations (scenario D, pessimistic intervention coverage and moderate effectiveness in both infants and seniors, compared to status quo scenario).
- Projected intervention benefits are highest in the targeted age groups: 21% (95% CI 16-24%) of RSV hospitalizations would be averted among seniors over 65 yrs and 15% (95% CI 4-24%) among infants under 1 yr, with 56% of total hospitalizations averted among infants (optimistic scenario).
- These results correspond to 1.24 (95% CI 0.45-2.03) infant hospitalization averted per 100 doses of monoclonals delivered in 2023-24) and 0.04 (0.03-0.05) senior hospitalization averted per 100 vaccine doses (optimistic scenario).
- The peak and cumulative hospitalization burden of the 2023-24 RSV season is likely to remain lower than that of the last season which had seen a large and unusual post-COVID-19 rebound of RSV, especially in children.
- Cumulative RSV hospitalizations for the period July 1, 2023 - June 1, 2024 are projected to reach 168,000 (95,500-303,000) for the most optimistic scenario compared with 183,000 (95%PI 106,000-315,000) for the counterfactual scenario.
- Ensemble projections suggest a prolonged period of RSV activity between November and March, with a peak most likely to occur in mid-December 2023. There is heterogeneity in projected RSV timing between the 12 states considered in this analysis, with most likely peak dates ranging between Nov 15, 2023 (Georgia, Tennessee) and Jan 15, 2024 (Utah).
- The combined impact of RSV, influenza, and COVID-19 on hospitalizations is likely to remain below that of last season (2022-23). Of note in 2022-23, there was concurrent activity of influenza, COVID-19, and RSV early in the season, resulting in a particularly high total hospitalization burden. Activity of these pathogens is projected to be more asynchronous this year.
- There is variability between states in the projected timing and intensity of RSV activity this season, due in part to geographic differences in the seasonality of RSV, impact of COVID-19 NPIs since 2020, and differences in testing and transmission intensities.
A few caveats are worth noting:
- Based on recent data on RSV intervention uptake in the US, our optimistic scenario A seems most closely aligned with reality.
- There are differences in the post-pandemic rebound of RSV across age groups, which are not fully understood nor accounted for by all models. In particular, projections tend to underestimate disease burden in seniors. These differences could be in part due to different strengths of NPIs between young children and adults during the COVID-19 period (e.g., masking propensities), and age-specific changes in RSV reporting.
- This is the first round of RSV projections, and there is limited availability of calibration data or past RSV modeling experience. This is the first time that the RSV-NET hospitalization dataset has been used for long-term projections. RSV-NET covers a fraction of 12 states (9% of the US population overall).
- Most models assume that RSV interventions will not reduce infection or transmission, so indirect benefits are close to zero in ensemble estimates.
- Testing practices continue to evolve in the wake of the COVID-19 pandemic (e.g., increased use of multi-pathogen testing), which may affect reported hospitalizations in the RSV-NET system. This will affect comparison with our projections and with prior year hospitalization data.
For more detailed information, please consult the RSV Round 1 Scenario Modeling Hub Report available on the RSV Scenario Modeling Hub Github.
Table 1. RSV Scenario Modeling Hub round 1 2023-2024 scenarios. More detailed scenario definitions and model characteristics can be found at https://github.com/midas-network/rsv-scenario-modeling-hub.

