RSV
Scenario Modeling Hub
A Note on RSV Scenario Modeling Hub Round 1 2025-2026 (February 16, 2026)
The RSV Scenario Modeling Hub has generated seasonal hospitalization estimates for the 2025-26 season over a 45-week period running from July 27, 2025 to June 6, 2026. Four intervention scenarios were considered, representing high and moderate coverage of infant interventions (maternal vaccines and long-acting monoclonal antibodies), and optimistic vs. pessimistic waning of vaccine protection among individual 50yrs and over. A fifth counterfactual scenario with no intervention was modeled for reference. Ensemble projections are based on contributions from 4 modeling teams using the linear opinion pool aggregation approach. All-age and age-specific estimates of RSV hospitalizations are provided nationally and for the 12 states that contribute to multi-year RSV-NET surveillance.
Our main findings include:
- On a national scale, and compared to the counterfactual, we project that 36% (95% confidence Interval [CI]: 31-41%) of seasonal RSV hospitalizations, or 18,000 (95% CI: 15,000–22,000) hospitalizations, will be averted among infants under 1yr in the scenario with high infant coverage and slow senior waning (scenario A), compared to non-intervention scenario (scenario E). With the same scenario comparison, immunization benefits among seniors over 65yrs amount to 28% (95% CI 19-37%) hospitalizations averted, or 19,000 (95% CI 8,000-29,000) hospitalizations. Further, with the same assumptions, the vaccination program would avert 2,700 (95% CI 1,600-3,800) hospitalizations among high-risk individuals 50-64 yo, who are also targeted for vaccination.
- Estimates of intervention benefits are sensitive to assumptions about vaccine waning and immunization coverage. In optimistic scenarios assuming a slow waning of vaccine protection in the second and third year after vaccine receipt, we project that 11% (95% CI 2-19%) and 4,800 (95% CI: 1,500-8,000) additional hospitalizations will be averted among seniors over 65yrs, compared to pessimistic scenarios modeling fast waning. In scenarios assuming high infant immunization coverage, we project 12% (10-14%) additional hospitalizations averted among infants, or 4,400 (95% CI 3,300-6,000) hospitalizations, compared to moderate coverage scenarios.
- The peak and cumulative hospitalization burden of the 2025-26 RSV season is likely to remain lower than that of last season and this is consistent across all intervention scenarios. On a national scale, RSV activity is most likely to peak from late December to late February, with the earliest peak expected in Southeastern and Midatlantic States (Georgia, Maryland, Tennessee) and the latest peak in Western states (Utah, Colorado, Oregon).
A few caveats are worth noting:
- Projections are based on only 4 participating models, which project different RSV seasonality and peak timing.
- Testing practices continue to evolve in the wake of the COVID-19 pandemic (e.g., increased use of multi-pathogen testing), which may affect reported hospitalizations in the RSV-NET system. Testing changes are not fully understood and imperfectly accounted for in the models.
- There is limited availability of calibration data from the RSV-NET hospitalization dataset, which covers only a fraction of 12 states (9% of the US population overall). Future work could focus on expanding these projections to all states as more data become available via the NHSN reporting system.
- Most models assume that RSV interventions do not affect susceptibility to infection or transmission, so that ensemble estimates of indirect benefits are minimal (i.e., mean estimates of hospitalization reduction in non-immunized individuals 1-49 years are within 0-2% depending on age group and scenario considered).
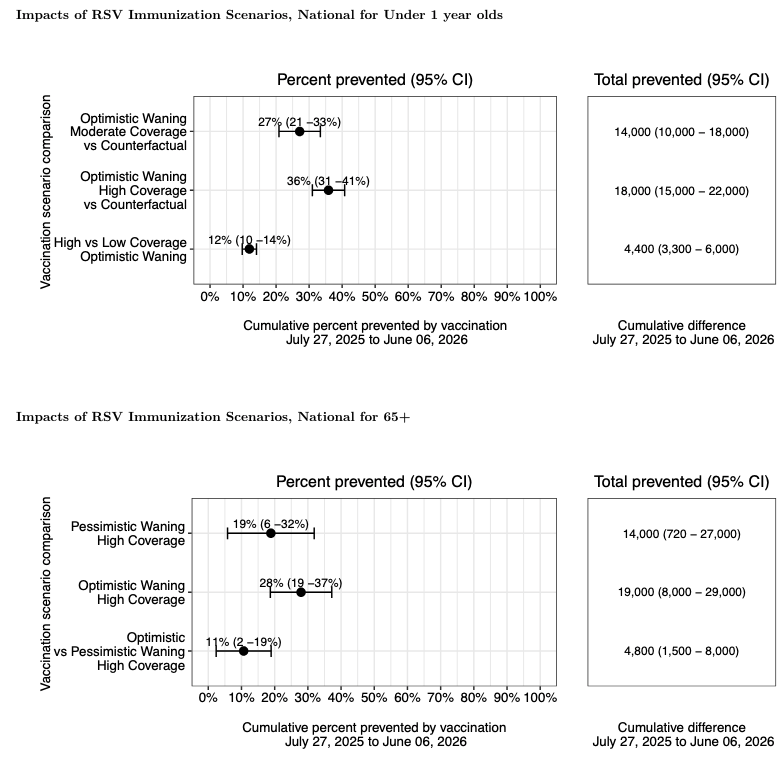
Figure 1. Impact of RSV Immunization Scenarios on Infant (< 1) and Senior (65 +)
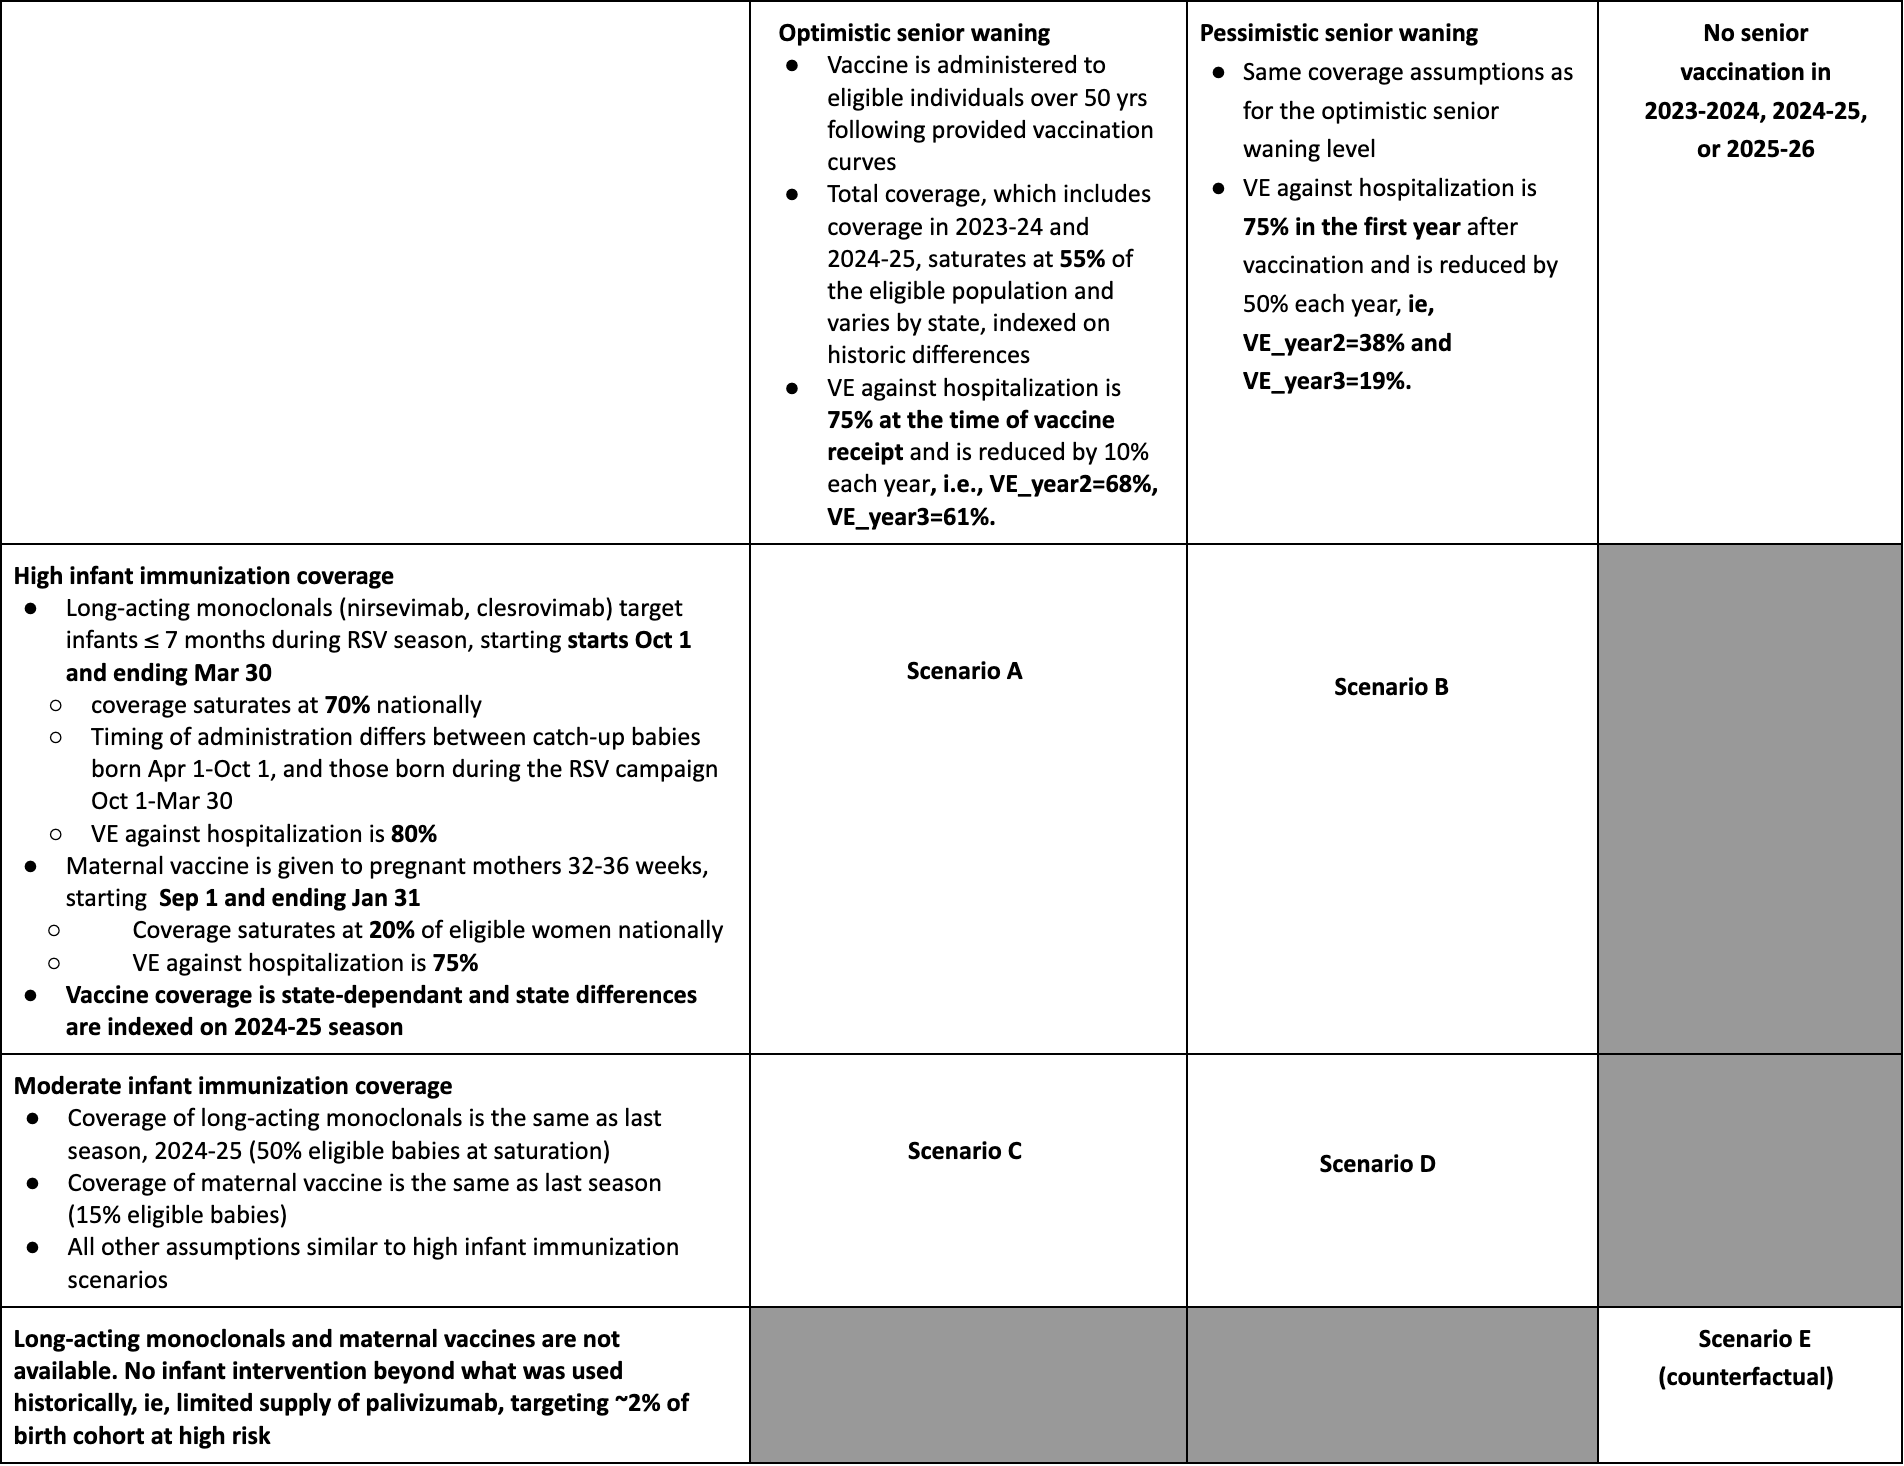
Table 1. RSV Scenario Modeling Hub round 1 2025-2026 scenarios. More detailed scenario definitions and model characteristics can be found at https://github.com/midas-network/rsv-scenario-modeling-hub.
Rationale
Even the best models of emerging infections struggle to give accurate forecasts at time scales greater than 3-4 weeks due to unpredictable drivers such as a changing policy environment, behavior change, the development of new control measures, and stochastic events. However, policy decisions around the course of emerging infections often require projections in the time frame of months. The goal of long-term projections is to compare outbreak trajectories under different scenarios, as opposed to offering a specific, unconditional estimate of what “will” happen.
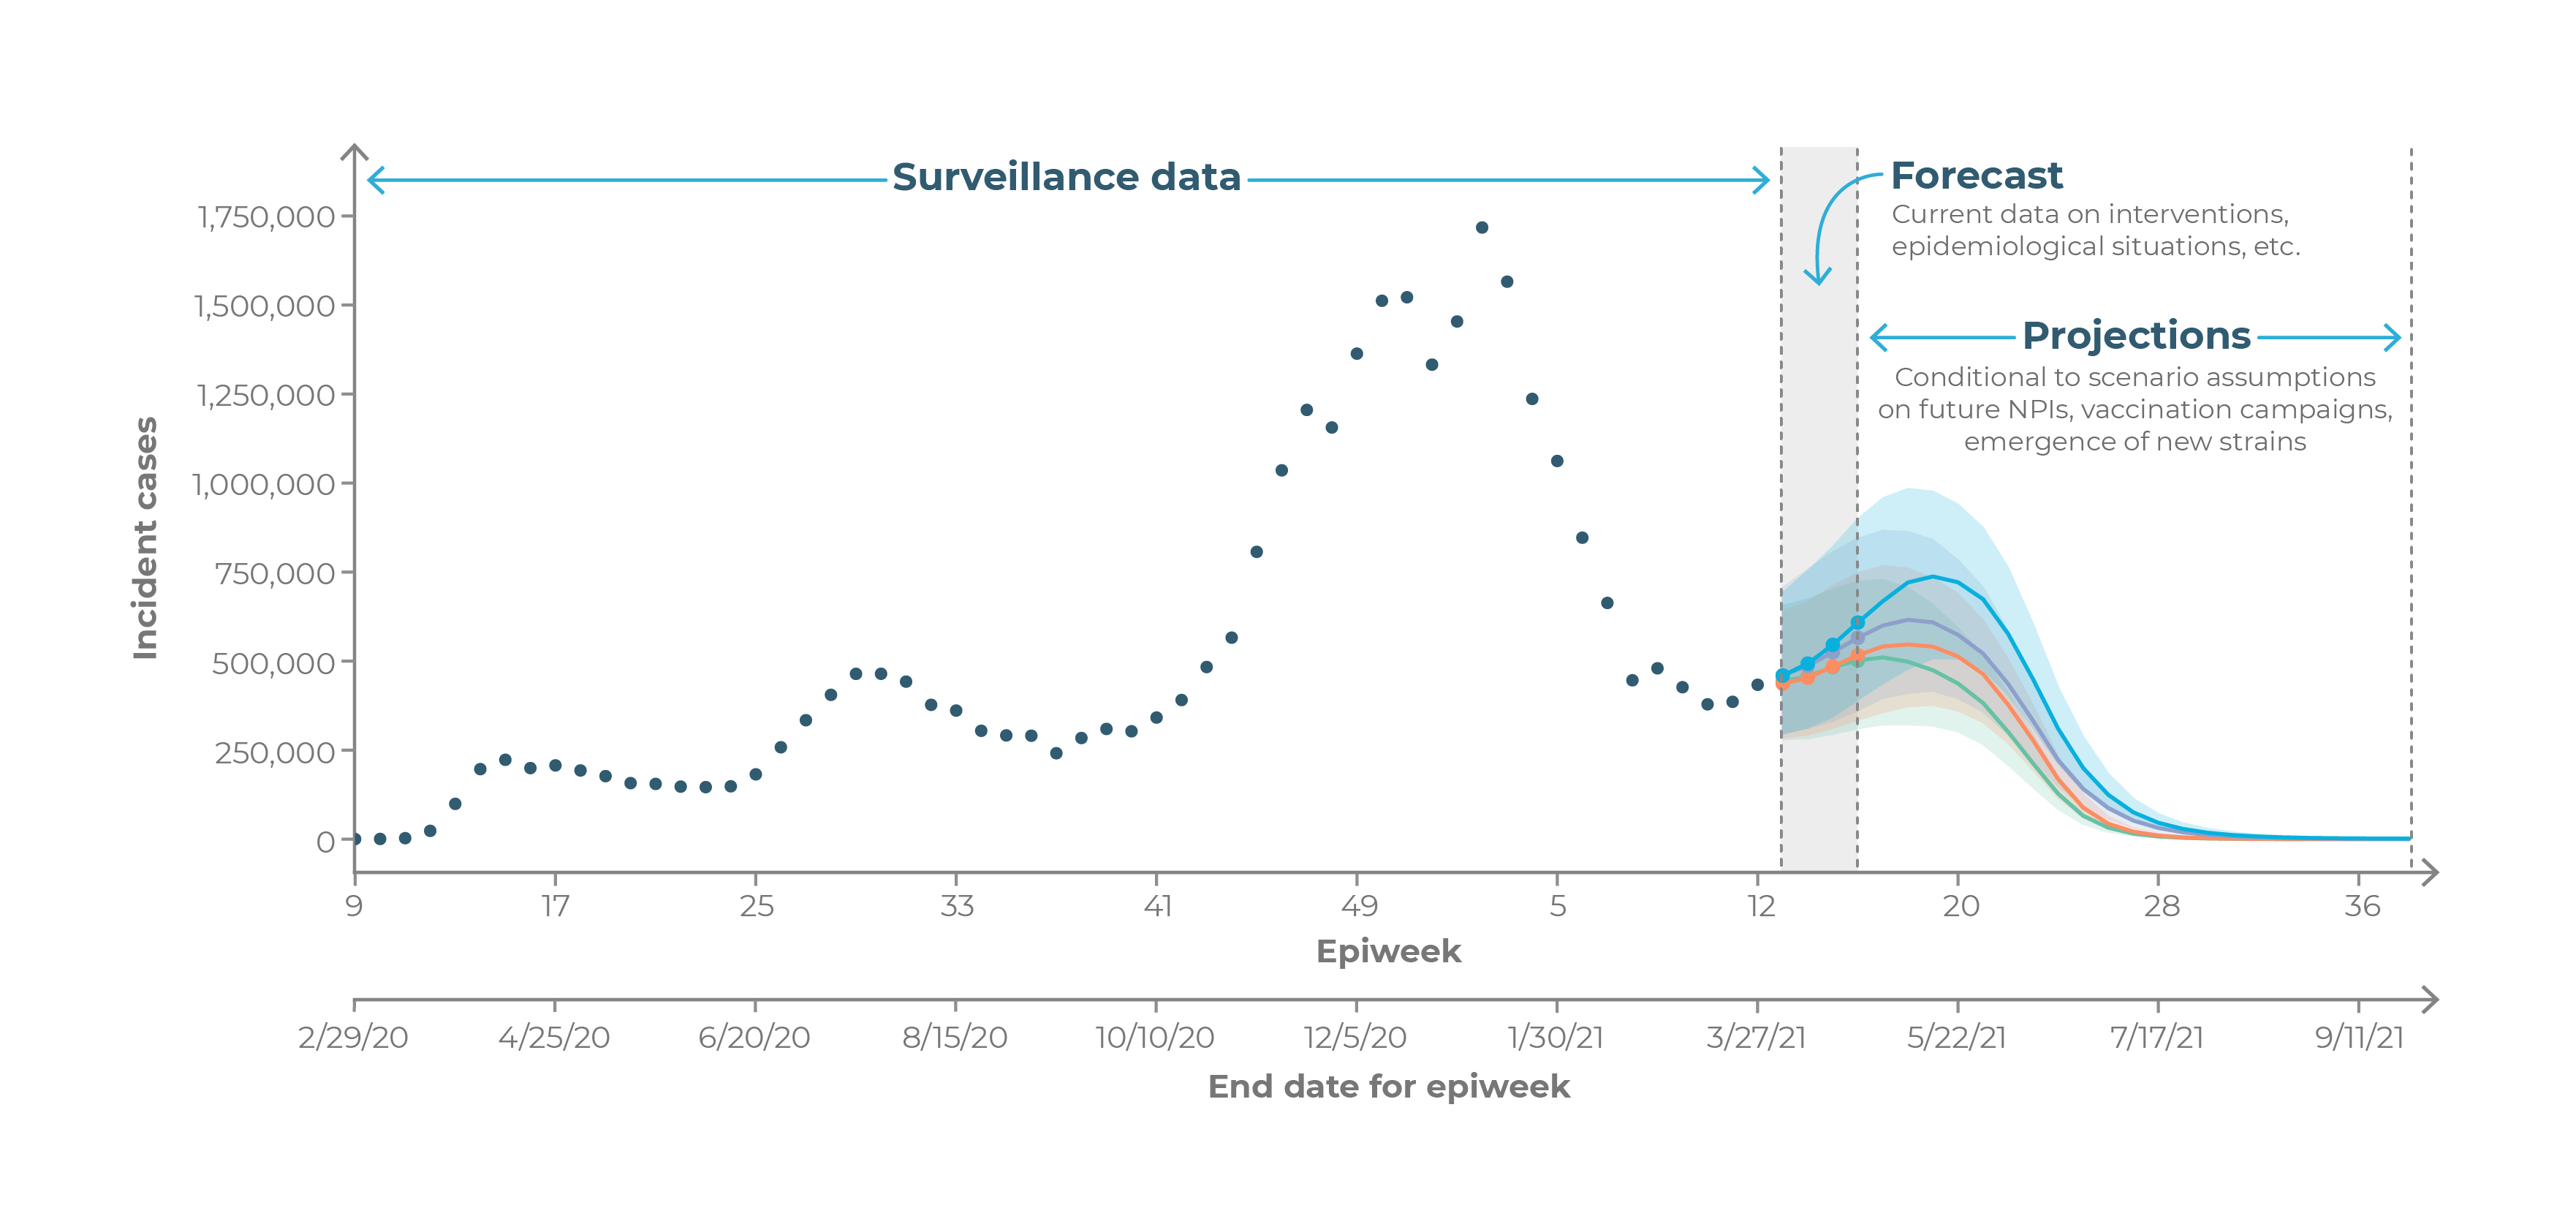
As such, long-term projections can guide longer-term decision-making while short-term forecasts are more useful for situational awareness and guiding immediate response.